- Research
- Open access
- Published:
Airway and parenchyma transcriptomics in a house dust mite model of experimental asthma
Respiratory Research volume 24, Article number: 32 (2023)
Abstract
Lung transcriptomics studies in asthma have provided valuable information in the whole lung context, however, deciphering the individual contributions of the airway and parenchyma in disease pathogenesis may expedite the development of novel targeted treatment strategies. In this study, we performed transcriptomics on the airway and parenchyma using a house dust mite (HDM)-induced model of experimental asthma that replicates key features of the human disease. HDM exposure increased the expression of 3,255 genes, of which 212 were uniquely increased in the airways, 856 uniquely increased in the parenchyma, and 2187 commonly increased in both compartments. Further interrogation of these genes using a combination of network and transcription factor enrichment analyses identified several transcription factors that regulate airway and/or parenchymal gene expression, including transcription factor EC (TFEC), transcription factor PU.1 (SPI1), H2.0-like homeobox (HLX), metal response element binding transcription factor-1 (MTF1) and E74-like factor 4 (ets domain transcription factor, ELF4) involved in controlling innate immune responses. We next assessed the effects of inhibiting lung SPI1 responses using commercially available DB1976 and DB2313 on key disease outcomes. We found that both compounds had no protective effects on airway inflammation, however DB2313 (8 mg/kg) decreased mucus secreting cell number, and both DB2313 (1 mg/kg) and DB1976 (2.5 mg/kg and 1 mg/kg) reduced small airway collagen deposition. Significantly, both compounds decreased airway hyperresponsiveness. This study demonstrates that SPI1 is important in HDM-induced experimental asthma and that its pharmacological inhibition reduces HDM-induced airway collagen deposition and hyperresponsiveness.
Introduction
Asthma is a chronic inflammatory lung disease with common symptoms of wheezing and shortness of breath associated with airway remodeling and hyperresponsiveness (AHR) [1,2,3]. Current therapies including bronchodilators and corticosteroids can be effective at managing symptoms and newer type 2-targeted biologics, such as duplizumab, may also be effective in subsets of patients with type 2-driven disease [4]. However, gaps remain in our understanding of what drives key disease features and current therapies may not be effective in all patients.
Transcriptomic studies in asthma have provided valuable information in the whole lung context [5,6,7], however, deciphering the individual contributions of the airway and parenchyma in disease pathogenesis may expedite the development of novel tissue-specific treatment strategies. A significant challenge in the study of gene expression patterns is deciphering the relationships between a large number of differentially expressed genes and overall functional effects. To address this, a network-based approach is being increasingly adopted to systematically explore the complex and dynamic transcriptional changes underlying diseases such as asthma and chronic obstructive pulmonary disease [8,9,10,11,12,13]. By utilizing bioinformatics tools such as weighted gene correlation network analysis (WGCNA) [14], co-expression network analysis can provide a holistic view of the global connectivity structure and functional organization of the gene expression program and identify subtle disease-associated changes in correlation structure that are not detected by conventional differential gene expression analysis [11, 15]. Furthermore, since disease-associated genes often interact to form disease modules [8], insights gained from co-expression network analysis can be leveraged to infer upstream module-driving genes that control entire disease pathways and can become promising therapeutic targets [11, 16].
In this study, we performed airway and parenchyma transcriptomics using a house dust mite (HDM)-induced model of experimental asthma that replicates key features of the human disease [17, 18]. Interrogation of HDM-induced genes using WGCNA upstream module analysis identified several transcription factors that regulate airway and/or parenchymal gene expression, including transcription factor PU.1 (SPI1). SPI1 inhibition using specific small molecule inhibitors, DB1976 or DB2313, had no protective effects on airway inflammation. However, DB2313 (8 mg/kg) decreased airway mucus secreting cell numbers, and DB2313 (1 mg/kg) and DB1976 (2.5 mg/kg and 1 mg/kg) reduced small airway collagen deposition. Both compounds decreased AHR. This study reveals important differences between the airway and parenchyma transcriptomic profiles in a HDM-induced model of asthma. We also demonstrate that SPI1 is important in HDM-induced experimental asthma pathogenesis and that its pharmacological inhibition reduces HDM-induced collagen deposition and AHR.
Materials and methods
Mice and ethics
Female wild-type BALB/c mice (Animal Resource Centre, Western Australia) were housed under specific pathogen-free conditions in the Hunter Medical Research Institute, Australia PC2 facility and maintained on a 12-hour day-night cycle with water and regular chow available ad libitum. Female BALB/c mice were chosen for this study due to their increased susceptibility to allergic airway inflammation induced by HDM [19]. All studies were performed under protocols approved by the Animal Care and Ethics Committee at the University of Newcastle.
Model and treatments
Mice were treated intranasally with house dust mite (HDM; Dermatophagoides pteronyssinus) extract (25 µg in 30 µL phosphate buffered saline [PBS]; 15G10, Citeq Biologics) or saline (vehicle), 5 days per week for 3 weeks [17, 18]. Some groups of HDM-treated mice were treated with DB1976 (1 mg/kg or 2.5 mg/kg in PBS; #HY-135,797 A, MedChemExpress) or DB2313 (1 mg/kg or 8 mg/kg in PBS; #AOB33333, Aobious).
Bronchoalveolar lavage, mucus-secreting cells (MSCs) and collagen deposition
Bronchoalveolar lavage fluid was collected as previously described [20,21,22,23]. MSCs were stained and counted as previously described [17, 24, 25]. Collagen was stained and analyzed as previously described [17, 18, 23, 25]. Additional details are provided in the online supplement.
qPCR
Total RNA was isolated from homogenized lung tissue with TRIzol® Reagent (Invitrogen™) [26,27,28]. Random-primed reverse transcriptions were performed followed by real-time qPCRs. Spi1 (Forward primer: 5’-AAGCAGGGGATCTGACCAAC-3’; Reverse primer: 5’-AAGTCATCCGATGGAGGGGC-3’) gene expression was normalized to the expression of the transcript of the housekeeping gene hypoxanthine guanine phosphoribosyltransferase (Hprt) (Forward primer: 5’-AGGCCAGACTTTGTTGGATTTGAA-3’; Reverse primer: 5’-CAACTTGCGCTCATCTTAGGCTTT-3’). All reactions were performed using BioScript™ reverse transcriptase in 1x first-strand buffer according to the manufacturer’s instructions (Bioline). Real-time qPCR assays were performed with SYBR Green Supermix (KAPA Biosystems) and a Mastercycler® ep realplex2 system (Eppendorf South Pacific).
Lung function
Airway hyperresponsiveness was assessed using the forced oscillation technique on a Scireq Flexivent FX1 machine as previously described [29, 30]. Additional details are provided in the online supplement.
RNA extraction, bioanalysis, RNA-sequencing, differential gene expression and network analysis
Lung airway and parenchyma tissues were separated by blunt dissection under a dissection microscope as previously described [22]. Details for RNA extraction, bioanalysis, RNA-sequencing and analysis are provided in the online supplement. Differential gene expression and network analysis were performed as previously described [16, 31, 32] and details are provided in the online supplement.
Statistics
Comparisons between two groups were performed using an unpaired t-test. Comparisons between multiple groups were carried out using one-way ANOVA with Sidak’s post-hoc test. AHR data was analyzed using two-way ANOVA with Bonferroni post-hoc test. All statistical analyses were carried out using Prism software (GraphPad version 9.0.0) and data are presented as mean ± SEM. A P value < 0.05 was considered statistically significant.
Results
Airway and parenchyma RNA-seq from HDM- and PBS-exposed mice reveals distinct gene expression in different tissue compartments
Airway and parenchyma tissues from mice exposed to HDM were subjected to bulk RNA-Seq and compared to PBS vehicle exposed controls (Fig. 1A). Principal component analysis revealed distinct transcriptomic signatures associated with each type of exposure and also distinct separations between the airway and parenchyma within each exposure type (Fig. 1B). mRNAs with altered expression in airway (Fig. 1C) and parenchyma (Fig. 1D) in HDM-exposed mice compared to PBS controls were visualized by volcano plots. Combining the lists of mRNAs with altered expression in airway and parenchyma compartments revealed that HDM exposure resulted in 3,255 upregulated genes and 2905 downregulated genes (log2FC ≥ 1 or ≤ -1, adj.p.val < 0.05) (Fig. 1E). Of these genes, 212 and 856 were upregulated, and 559 and 789 downregulated, in airways and parenchyma, respectively (Fig. 1E). There were 6 common genes that were upregulated in parenchyma and downregulated in airways. Gene enrichment analysis showed similar GO biological pathways upregulated in airways and parenchyma, including leukocyte migration and regulation of cytokine responses, whereas similar downregulated pathways included muscle development and muscle system processes. Furthermore, gene cluster changes in blood circulation and circulatory system processes were found to be up- and down-regulated in parenchyma samples and downregulated in airway samples (Fig. 1F). These data demonstrate key differences between mRNA expression in airway and parenchyma following HDM exposure.

Airway and parenchyma RNA-seq from HDM- and PBS-exposed mice reveals compartment- and exposure-specific gene expression. A HDM (25 µg/30 µL) or PBS (30 µL) was administered intranasally 5 days/week for 3 weeks. B Principal component analysis plot of HDM and PBS airway and parenchyma samples HDM (n = 10) and PBS (n = 12). Volcano plots of upregulated (red) and downregulated (blue) gene transcripts in airway (C) and parenchyma (D), dotted line represents P = 0.05. E Venn diagram of up- and down-regulated genes in the airways and parenchyma. F Gene enrichment analysis in the airways and parenchyma
Network analysis identifies common and distinct upstream module-driving genes in airways and parenchyma from HDM- compared to PBS-exposed mice
A powerful way to identify disease-associated biological mechanisms is to define the intersection between disease-associated gene networks and differential gene expression. By overlaying functionally distinct gene modules identified by network analysis with differentially expressed genes, disease-associated modules in different settings can be defined. To visualize this, bubble plots for each differential gene expression cluster were generated where the median adjusted p-value for all genes within a module was compared against the median log fold-change, and the bubble size representative of the number of genes within a module for the airways (Fig. 2A, Additional file 1: Table S1) and parenchyma (Fig. 2B, Additional file 1: Table S1). Having identified specific disease-associated network modules, we next examined the transcription factors responsible for driving these transcriptional changes. We identified a driver gene signature for each disease-associated module by selecting the genes with a module connectivity greater than 2 times the standard deviation from the mean, and with an adjusted p-value < 0.01 in terms of differential gene expression. We then used ChIP-X Enrichment Analysis 3 (ChEA3), which leverages prior knowledge about transcription factor targets assembled multiple resources including ChIP-seq experiments, to identify the top 10 predicted transcription factors for which their downstream targets had a significant overlap with our driver gene signatures. The three largest modules in the airways and parenchyma were innate immune, cell cycle and molecule transport/localization responses. Interestingly, the top 10 transcription factors by mean rank were similar in the cell cycle modules in the airway and parenchyma, however, there were differences in their rank order (Fig. 2A, B). Together, these data demonstrate key differences in predicted transcription factors that drive HDM-induced disease responses in the airways and parenchyma.
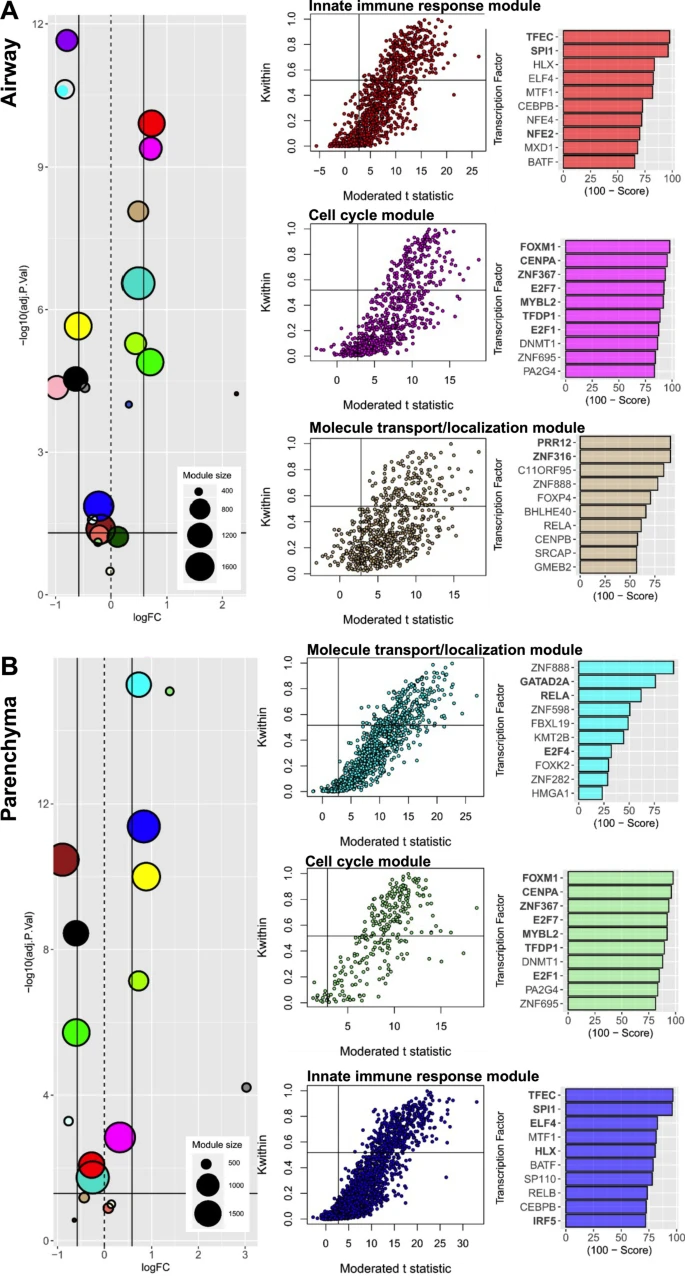
Upstream module-driving genes in the airways and parenchyma from HDM- compared to PBS-exposed mice. A Airway and B parenchyma compartments from HDM- (n = 10) compared to PBS-exposed mice (n = 12). Bubble plots for each differential gene expression cluster where the median adjusted p-value for all genes within a module was plotted against the median log fold-change, bubble size is representative of the number of genes within a module. ChIP-X Enrichment Analysis 3 (ChEA3) of the top ten predicted transcription factors with significant overlap with our driver gene signatures for A airway and B parenchyma compartments from HDM- (n = 10) compared to PBS-exposed mice (n = 12)
SPI1 inhibition with DB1976 and DB2313 treatments has differential effects on weight loss and airway inflammation but inhibits airway remodeling
SPI1 was one of the upstream transcription factors identified in our RNA-seq data that was predicted to be responsible for driving transcriptional changes in both the airways and parenchyma. Importantly, SPI1 also has commercially available pharmacological inhibitors. Therefore, we confirmed the increased mRNA expression of Spi1 following 3-weeks of HDM exposure (Fig. 3A). We also interrogated SPI1 expression in single-cell data from the integrated Human Lung Cell Atlas [33] and The Human Protein Atlas [34] and showed that SPI1 expression is highest in lung macrophages (Additional file 1: Figure S1 and Additional file 1: Figure S2). Then, to assess the effects of therapeutically targeting SPI1 on HDM-induced experimental asthma, we administered DB1976 and DB2313, that interact with the DNA minor groove that flanks the PU.1 binding motif to inhibit its activity, throughout the model (Fig. 3B). HDM alone and HDM + DB1976 had minimal effects on body weight, however, HDM + DB2313 resulted in significant weight loss at both 1 mg/kg and 8 mg/kg compared to HDM alone (Fig. 3C).
HDM exposure increased inflammation in the airways and total leukocyte numbers in the BALF, consisting of macrophages, neutrophils, eosinophils and lymphocytes (Fig. 3D–H). DB1976 treatment largely had no effect on HDM-induced cellular inflammation, although treatment with 1 mg/kg increased eosinophil numbers (Fig. 3G). DB2313 treatment further increased HDM-induced total leukocytes (Fig. 3D), which were primarily neutrophils (Fig. 3F), and at 8 mg/kg reduced eosinophil numbers (Fig. 3G).
Exposure to HDM increased airway-associated mucus secreting cell numbers, which were reduced back to baseline levels with DB2313, but not DB1976, treatment at both doses (Fig. 3I). HDM exposure also increased airway fibrosis and small airway collagen deposition, and treatment with DB1976 (1 mg/kg and 2.5 mg/kg) and DB2313 (1 mg/kg) almost completely inhibited collagen deposition, which were at levels similar to baseline in PBS-exposed controls (Fig. 3J).
Together, these data demonstrate differential effects of DB1976 and DB2313 on HDM-induced airway inflammation and remodeling.

Pharmacological targeting of SPI1 affects weight loss, airway inflammation, and airway remodeling. A Spi1 mRNA expression in PBS- and HDM-exposed mice. B Representative models of PBS (30 µL), HDM (25 µg/30 µL), HDM + DB1976 (1 mg/kg or 2.5 mg/kg) or HDM + DB2313 (1 mg/kg or 8 mg/kg) exposure intranasally 5 days/week for 3 weeks. C Percentage body weight of mice at the end of the model. D Total leukocytes, E macrophages, F neutrophils, G eosinophils and H lymphocytes in BALF. I AB-PAS staining for airway-associated mucus-secreting cells that were enumerated per µm of basement membrane. J Small airway collagen deposition measured using Sirius Red/Fast Green staining of lung sections and quantified per µm of basement membrane. All scale bars = 100 µm. Data expressed as mean ± SEM (n = 6–8 for each group). *P < 0.05, **P < 0.01, ***P < 0.001, ****P < 0.0001, A: unpaired t-test, C-J one-way ANOVA, Sidak’s post hoc test
DB1976 and DB2313 treatments inhibit HDM-induced AHR
To assess the functional effects of targeting SPI1 on HDM-induced experimental asthma, we measured AHR following treatment with DB1976 and DB2313 throughout the model. HDM exposure substantially increased transpulmonary resistance (Rrs, Fig. 4A) and elastance (Ers, Fig. 4B), and decreased compliance (Crs, Fig. 4C) compared to PBS controls. Treatment with DB1976 (1 mg/kg and 2.5 mg/kg) and DB2313 (1 mg/kg and 8 mg/kg) decreased resistance and elastance. Treatment with DB2313 at 8 mg/kg completely inhibited the development of resistance and elastance and increased Crs back to baseline levels that were similar to those in PBS-exposed controls (Fig. 4C). Together these data show that DB1976 and especially DB2313 treatment inhibits HDM-induced AHR.

DB1976 and DB2313 treatments inhibit airway hyperresponsiveness in HDM-induced experimental asthma. Airway hyperresponsiveness measured in response to increasing doses of methacholine: A transpulmonary resistance (Rrs), B elastance (Ers) and C compliance (Crs). Data expressed as mean ± SEM (n = 6–8 for each group). *P < 0.05, ***P < 0.001, ****P < 0.0001. Two-way ANOVA, Bonferroni post hoc test
Interrogation of downstream genes of SPI1 in human single cell data
We next used our mouse transcriptomics data to prioritise genes downstream of SPI1 with the highest logFC value in both airway and parenchyma between HDM and PBS mice and identified Interleukin 1 Receptor Antagonist (Il1rn), Platelet Activating Factor Receptor (Ptafr), Integrin Subunit Alpha X (Itgax), and C-type lectin domain family 7 member A (Clec7a). Significantly, cross-comparison with the Human Protein Atlas [34] shows that these genes are also highly co-expressed in human lung macrophages (Additional file 1: Figure S2).
Discussion
The individual contributions of the airways and parenchyma in asthma pathogenesis is incompletely understood. Here, we performed transcriptomic analysis of the airways and parenchyma in a HDM-induced model of experimental asthma. Our approach, which was sufficiently powered (n = 10 per group) to assess upstream drivers of disease, highlights key similarities and differences between the airways and parenchyma. Notably, SPI1 was similarly upregulated in both the airways and parenchyma. Using pharmacological inhibitors of SPI1, DB1976 and DB2313, we show that treatment with these compounds has differential effects at different doses on airway-associated mucus secreting cell numbers and small airway collagen deposition, with no protective effects on airway inflammation. Significantly, both compounds at either dose decreased airway hyperresponsiveness, with DB2313 at 8 mg/kg having the strongest effect. Our study demonstrates the importance of assessing airway and parenchyma transcriptomics separately in HDM-induced experimental asthma. We define SPI1 as an important disease-associated transcription factor in both tissues and that its pharmacological inhibition may be a novel treatment strategy for the most intractable features of chronic asthma.
We first showed that the separation of airway and parenchyma data and in response to PBS or HDM on the PCA plot, are likely consequences of differences in the baseline gene expression profiles of the two tissue types, and HDM exposure. This is likely due to the different cellular compositions of these two compartments, including airway smooth muscle cells in the airway compartment, and ATII cells in the parenchyma. We next showed that there are distinctive sets of differentially expressed genes in the airways and parenchyma in HDM-induced experimental asthma. Gene cluster analysis showed that some similar pathways are upregulated in the airways and parenchyma, including leukocyte migration and regulation of cytokine responses, and these are comprised of numerous genes known to be involved in the early phase of allergen-induced airway inflammation [35]. Interestingly, downregulated pathways, including muscle development and muscle system processes, were found in both the airways and parenchyma. It is well established that airway smooth muscle plays key roles in asthma, including in airway hyperresponsiveness [36]. However, less is known about the role of vascular smooth muscle, although it has been shown that glucocorticoid treatment in asthma can increase airway vascular smooth muscle contraction and decrease airway blood flow [37]. Our analysis shows that the downregulation of genes involved airway and vascular smooth muscle development and processes may be common to both processes and dysregulated in asthma. Furthermore, gene cluster changes in blood circulation and circulatory system processes were found to be up- and down-regulated in parenchyma samples and downregulated in airway samples. These data highlight a complex relationship between vascular smooth muscle, blood circulation and circulatory system processes in experimental asthma that warrants further investigation.
We next utilized WGCNA to unveil mechanisms that may not be detected through standard differential gene expression analysis. The three largest median increase in expression with HDM exposure modules in the airways and parenchyma consisted of innate immune, cell cycle and molecule transport/localization responses. We then used ChEA3 [16] to rank transcription factors based on pooled information across six transcription factor target gene set libraries to identify those responsible for the observed changes in gene expression. Interestingly, the top 10 transcription factors by mean rank were similar in cell cycle modules in both the airways and parenchyma, however, there were some differences in the innate immune and molecule transport/localization responses in the airways and parenchyma.
We next interrogated the role of the transcription factor Spi1 that is involved in the innate immune system module. Spi1 was upregulated in both the airways and parenchyma, and belongs to the erythroblast transformation specific (ETS) family of transcription factors that mediate a wide range of cellular processes, including growth, differentiation, signaling, and apoptosis [38]. Spi1 also has known roles as a master regulator of hematopoiesis [39, 40], and is expressed in the respiratory tract, brain, endocrine tissues, gastrointestinal tract, liver and gallbladder, pancreas, kidney and urinary system, reproductive tract, muscle tissues, skin, bone marrow and lymphoid tissues. DB1976 and DB2313 are small molecule SPI1 inhibitors that are heterocyclic diamidines that bind with high specificity to AT-rich sequences in the DNA minor groove that is selective for the SPI1 protein and thus competitively inhibit SPI1 binding [41, 42]. In acute myeloid leukemia, inhibition of SPI1 using these inhibitors resulted in the downregulation of SPI1 downstream targets and reduced tumor burden [42]. Furthermore, another study showed that DB1976 treatment downregulated pro-fibrotic gene expression in fibroblasts and had both preventative as well as therapeutic benefits in a bleomycin-induced skin fibrosis model [43].
In our study, treatment with DB1976 increased airway eosinophils and decreased small airway collagen deposition but had no effect on mucus secreting cell numbers. In contrast, DB2313 increased neutrophil numbers, and reduced mucus secreting cell numbers and completely inhibited collagen (at 1 mg/kg but not 8 mg/kg). Significantly, treatment with both drugs at either dose reduced airway hyperresponsiveness, with almost complete inhibition with DB2313 at 8 mg/kg. SPI1 is proposed to modulate the expression of over 3,000 genes in hematopoietic cells [44,45,46], therefore the differences in the effects of DB1976 and DB2313 may be linked to the specific downstream genes that were regulated, such as IL1RN, PTAFR, ITGAX and CLEC7A. Interestingly, some studies show that Spi1 can suppress Th2 cytokine expression, and that Spi1 expression can be upregulated through selective antagonism of microRNA (miR)-126 [47,48,49]. Likewise, the deletion of miR-155 is associated with the upregulated expression of Spi1 and reduced allergen-induced type 2 inflammation [50]. Whether these pathways are affected in HDM-induced experimental asthma warrant further investigation. Importantly, the expression of the majority of genes that can be regulated by Spi1 can also be controlled by other transcription factors, which complicates measuring genes that are proposed to be Spi1-dependent as a readout of DB2313 and DB1976 target specificity. It is also important to consider that we administered DB2313 and DB1976 via the intranasal route to direct these compounds into the lungs, but we cannot exclude the possibility that these compounds entered the circulation and exerted effects on Spi1 at peripheral sites. This is unlikely to affect the molecular specificity of these compounds to their target, but rather highlights that these extrapulmonary effects may promote feedback responses that exert effects on lung inflammation, structure, and function.
Whilst the effects of DB1976 and DB2313 on inflammation in HDM-induced experimental asthma were surprising, our data support the concept that inflammation, remodeling and AHR in allergic asthma can occur and be regulated independently [30, 51]. It is now well established that there is a disconnect between inflammation and AHR in asthma patients and that they are regulated by different processes. In support of our findings, a study of patients with chronic asthma showed no correlation between the numbers of inflammatory cells present in BALF and the level of AHR [52]. Our study, as well as those from others, provide strong evidence that airway remodeling can lead to constricted airways, which may drive the variation in AHR in asthma patients [52,53,54]. Currently, biologics for the treatment of severe asthma primarily focus on targeting inflammation. Our findings suggest that a broader set of drug targets remain to be discovered that can selectively target inflammation, remodeling, or both.
Interestingly, treatment with both DB1976 and DB2313 reduced features of airway remodeling and AHR, suggesting that HDM-induced Spi1 responses could drive these potentially inter-connected processes. Indeed, another study showed that DB1976 treatment of TGFβ-stimulated fibroblasts decreased COL1A1, α-SMA expression and F-actin [43], supporting the concept that Spi1 responses can promote remodeling. Taken together, the data show that it is likely that increased Spi1 responses can have context-dependent, dichotomous roles. Of note, our bioinformatics approach utilized a database of published findings to identify SPI1 as a key upstream driver of genes involved in the innate immune module, and our functional studies demonstrate that SPI1 is important in airway remodeling and AHR. Collectively, our data show that our approach has the capacity to identify new pathways and the functional effects of factors that may cross over several modules and can inform further studies that interrogate novel relationships. Future studies that examine the effects of different treatment regimens with DB1976 and DB2313, including treatment after establishment of disease, may provide additional insights into how these compounds affect remodeling and/or AHR.
A limitation of our study is the different high doses of DB1976 (2.5 mg/kg) and DB2313 (8 mg/kg) that were dictated by drug solubility and preclude direct dose-to-dose comparisons between the two highest doses of these drugs. However, at 1 mg/kg, the disparities in the physiological responses to DB1976 and DB2313 may partially be due to differences in their chemical structure and subsequent binding affinity. Indeed, reported IC50 values are lower for DB2313 compared to DB1976, indicating that DB2313 exhibits higher binding affinity for its target [42]. Whilst the selectivity of DB1976 and DB2313 for SPI1 has been established [41, 42], a rigorous examination of the specificity of these compounds against a large range of targets has not been performed. Differences in the specificity of these compounds could explain the differences in the physiological responses that were observed in vivo, and this will be important to examine in future studies. Additionally, DB1976 exhibits increased cellular toxicity in Lin−Sca1+c-Kit+ bone marrow cells from wild type mice compared to DB2313 [42], and DB2313 has more pronounced effects on reducing cell viability in THP-1 cells at high doses compared to DB1976 [42]. This suggests that high doses of these compounds have differential effects on cell viability depending on the type of cell that is exposed. However, which specific cell types are affected by intranasal drug administration in our model is unknown and a rigorous investigation of this is beyond the scope of our study but would be interesting to assess in future work by performing systemic, rather than lung local, administration. Furthermore, our study has used female mice, and it is well known that are sex-specific effects to allergen exposure [55], thus future studies examining the efficacy of DB1976 and DB2313 in male mice are warranted.
Our study demonstrates the advantages and value of using airway and parenchymal transcriptomics to assess and interrogate the roles of gene expression modules and upstream transcription factors at the lung local level. Importantly, we show that targeting one of these factors, Spi1, by direct administration of novel pharmacological agents allows us to delineate whether these modules are drivers or consequences of disease, and our data highlight the potential for targeting increased Spi1 responses in the lungs as a novel therapeutic strategy to reduce remodeling and AHR in asthma patients.
Availability of data and materials
All data is available upon request. RNA-sequencing data are available through the NCBI GEO database (GSE199853).
References
Eder W, Ege MJ, von Mutius E. The asthma epidemic. N Engl J Med. 2006;355:2226–35.
Galvao I, Kim RY, Shen S, Budden KF, Vieira AT, Hansbro PM. Emerging therapeutic targets and preclinical models for severe asthma. Expert Opin Ther Targets. 2020;24:845–57.
Hansbro PM, Kim RY, Starkey MR, Donovan C, Dua K, Mayall JR, Liu G, Hansbro NG, Simpson JL, Wood LG, et al. Mechanisms and treatments for severe, steroid-resistant allergic airway disease and asthma. Immunol Rev. 2017;278:41–62.
Hansbro PM, Scott GV, Essilfie AT, Kim RY, Starkey MR, Nguyen DH, Allen PD, Kaiko GE, Yang M, Horvat JC, Foster PS. Th2 cytokine antagonists: potential treatments for severe asthma. Expert Opin Investig Drugs. 2013;22:49–69.
Ito T, Hirose K, Saku A, Kono K, Takatori H, Tamachi T, Goto Y, Renauld JC, Kiyono H, Nakajima H. IL-22 induces Reg3gamma and inhibits allergic inflammation in house dust mite-induced asthma models. J Exp Med. 2017;214:3037–50.
Kinker KG, Gibson AM, Bass SA, Day BP, Deng J, Medvedovic M, Figueroa JA, Hershey GK, Chen W. Overexpression of dimethylarginine dimethylaminohydrolase 1 attenuates airway inflammation in a mouse model of asthma. PLoS ONE. 2014;9:e85148.
Pascoe CD, Jha A, Basu S, Mahood T, Lee A, Hinshaw S, Falsafi R, Hancock REW, Mookherjee N, Halayko AJ. The importance of reporting house dust mite endotoxin abundance: impact on the lung transcriptome. Am J Physiol Lung Cell Mol Physiol. 2020;318:L1229-36.
Barabasi AL, Gulbahce N, Loscalzo J. Network medicine: a network-based approach to human disease. Nat Rev Genet. 2011;12:56–68.
Jones AC, Bosco A. Using Network Analysis to understand severe asthma phenotypes. Am J Respir Crit Care Med. 2017;195:1409–11.
Bosco A, Ehteshami S, Panyala S, Martinez FD. Interferon regulatory factor 7 is a major hub connecting interferon-mediated responses in virus-induced asthma exacerbations in vivo. J Allergy Clin Immunol. 2012;129:88–94.
Troy NM, Hollams EM, Holt PG, Bosco A. Differential gene network analysis for the identification of asthma-associated therapeutic targets in allergen-specific T-helper memory responses. BMC Med Genomics. 2016;9:9.
Paci P, Fiscon G, Conte F, Licursi V, Morrow J, Hersh C, Cho M, Castaldi P, Glass K, Silverman EK, Farina L. Integrated transcriptomic correlation network analysis identifies COPD molecular determinants. Sci Rep. 2020;10:3361.
Veerati PC, Troy NM, Reid AT, Li NF, Nichol KS, Kaur P, Maltby S, Wark PAB, Knight DA, Bosco A, et al. Airway Epithelial Cell immunity is delayed during rhinovirus infection in Asthma and COPD. Front Immunol. 2020;11:974.
Zhang B, Horvath S. A general framework for weighted gene co-expression network analysis. Stat Appl Genet Mol Biol. 2005;4:Article17.
de Jong E, Bosco A. Unlocking immune-mediated disease mechanisms with transcriptomics. Biochem Soc Trans. 2021;49:705–14.
Keenan AB, Torre D, Lachmann A, Leong AK, Wojciechowicz ML, Utti V, Jagodnik KM, Kropiwnicki E, Wang Z. Ma’ayan A. ChEA3: transcription factor enrichment analysis by orthogonal omics integration. Nucleic Acids Res. 2019;47:W212-24.
Ali MK, Kim RY, Brown AC, Mayall JR, Karim R, Pinkerton JW, Liu G, Martin KL, Starkey MR, Pillar AL, et al. Crucial role for lung iron level and regulation in the pathogenesis and severity of asthma. Eur Respir J. 2020;55:1901340.
Liu G, Cooley MA, Nair PM, Donovan C, Hsu AC, Jarnicki AG, Haw TJ, Hansbro NG, Ge Q, Brown AC, et al. Airway remodelling and inflammation in asthma are dependent on the extracellular matrix protein fibulin-1c. J Pathol. 2017;243:510–23.
Sahu N, Morales JL, Fowell D, August A. Modeling susceptibility versus resistance in allergic airway disease reveals regulation by tec kinase itk. PLoS ONE. 2010;5:e11348.
Starkey MR, Plank MW, Casolari P, Papi A, Pavlidis S, Guo Y, Cameron GJM, Haw TJ, Tam A, Obiedat M, et al. IL-22 and its receptors are increased in human and experimental COPD and contribute to pathogenesis. Eur Respir J. 2019;54:8.
Liu G, Cooley MA, Jarnicki AG, Hsu AC, Nair PM, Haw TJ, Fricker M, Gellatly SL, Kim RY, Inman MD, et al. Fibulin-1 regulates the pathogenesis of tissue remodeling in respiratory diseases. JCI Insight. 2016;1:78.
Haw TJ, Starkey MR, Nair PM, Pavlidis S, Liu G, Nguyen DH, Hsu AC, Hanish I, Kim RY, Collison AM, et al. A pathogenic role for tumor necrosis factor-related apoptosis-inducing ligand in chronic obstructive pulmonary disease. Mucosal Immunol. 2016;9:859–72.
Donovan C, Starkey MR, Kim RY, Rana BMJ, Barlow JL, Jones B, Haw TJ, Mono Nair P, Budden K, Cameron GJM, et al. Roles for T/B lymphocytes and ILC2s in experimental chronic obstructive pulmonary disease. J Leukoc Biol. 2019;105:143–50.
Thorburn AN, O’Sullivan BJ, Thomas R, Kumar RK, Foster PS, Gibson PG, Hansbro PM. Pneumococcal conjugate vaccine-induced regulatory T cells suppress the development of allergic airways disease. Thorax. 2010;65:1053–60.
Nair PM, Starkey MR, Haw TJ, Liu G, Horvat JC, Morris JC, Verrills NM, Clark AR, Ammit AJ, Hansbro PM. Targeting PP2A and proteasome activity ameliorates features of allergic airway disease in mice. Allergy. 2017;72:1891–903.
Fricker M, Goggins BJ, Mateer S, Jones B, Kim RY, Gellatly SL, Jarnicki AG, Powell N, Oliver BG, Radford-Smith G, et al. Chronic cigarette smoke exposure induces systemic hypoxia that drives intestinal dysfunction. JCI Insight. 2018;3:7834.
Hsu AC, Dua K, Starkey MR, Haw TJ, Nair PM, Nichol K, Zammit N, Grey ST, Baines KJ, Foster PS, et al. MicroRNA-125a and -b inhibit A20 and MAVS to promote inflammation and impair antiviral response in COPD. JCI Insight. 2017;2:e90443.
Kim RY, Sunkara KP, Bracke KR, Jarnicki AG, Donovan C, Hsu AC, Ieni A, Beckett EL, Galvao I, Wijnant S, et al. A microRNA-21-mediated SATB1/S100A9/NF-kappaB axis promotes chronic obstructive pulmonary disease pathogenesis. Sci Transl Med. 2021;13:eaav7223.
Kim RY, Pinkerton JW, Essilfie AT, Robertson AAB, Baines KJ, Brown AC, Mayall JR, Ali MK, Starkey MR, Hansbro NG, et al. Role for NLRP3 Inflammasome-mediated, IL-1beta-Dependent responses in severe, steroid-resistant asthma. Am J Respir Crit Care Med. 2017;196:283–97.
Kim RY, Horvat JC, Pinkerton JW, Starkey MR, Essilfie AT, Mayall JR, Nair PM, Hansbro NG, Jones B, Haw TJ, et al. MicroRNA-21 drives severe, steroid-insensitive experimental asthma by amplifying phosphoinositide 3-kinase-mediated suppression of histone deacetylase 2. J Allergy Clin Immunol. 2017;139:519–32.
Tu X, Kim RY, Brown AC, de Jong E, Jones-Freeman B, Ali MK, Gomez HM, Budden KF, Starkey MR, Cameron GJM, et al. Airway and parenchymal transcriptomics in a novel model of asthma and COPD overlap. J Allergy Clin Immunol. 2022;150:817–29.e6.
Yu G, Wang LG, Han Y, He QY. clusterProfiler: an R package for comparing biological themes among gene clusters. OMICS. 2012;16:284–7.
Sikkema L, Strobl D, Zappia L, Madissoon E, Markov NS, Zaragosi L, Ansari M, Arguel M, Apperloo L, Bécavin C, et al. An integrated cell atlas of the human lung in health and disease. bioRxiv 2022:2022.2003.2010.483747.
Karlsson M, Zhang C, Mear L, Zhong W, Digre A, Katona B, Sjostedt E, Butler L, Odeberg J, Dusart P, et al. A single-cell type transcriptomics map of human tissues. Sci Adv 2021, 7. Human Protein Atlas proteinatlas.org. https://www.proteinatlas.org/ENSG00000066336-SPI1/single+cell+type/lung; https://www.proteinatlas.org/ENSG00000136689-IL1RN/single+cell+type/lung; https://www.proteinatlas.org/ENSG00000169403-PTAFR/single+cell+type/lung; https://www.proteinatlas.org/ENSG00000140678-ITGAX/single+cell+type/lung; https://www.proteinatlas.org/ENSG00000172243-CLEC7A/single+cell+type/lung; v21.proteinatlas.org.
Galli SJ, Tsai M, Piliponsky AM. The development of allergic inflammation. Nature. 2008;454:445–54.
An SS, Bai TR, Bates JH, Black JL, Brown RH, Brusasco V, Chitano P, Deng L, Dowell M, Eidelman DH, et al. Airway smooth muscle dynamics: a common pathway of airway obstruction in asthma. Eur Respir J. 2007;29:834–60.
Wanner A, Horvath G, Brieva JL, Kumar SD, Mendes ES. Nongenomic actions of glucocorticosteroids on the airway vasculature in asthma. Proc Am Thorac Soc. 2004;1:235–8.
Oikawa T, Yamada T. Molecular biology of the ets family of transcription factors. Gene. 2003;303:11–34.
Scott EW, Simon MC, Anastasi J, Singh H. Requirement of transcription factor PU.1 in the development of multiple hematopoietic lineages. Science. 1994;265:1573–7.
Scott EW, Fisher RC, Olson MC, Kehrli EW, Simon MC, Singh H. PU.1 functions in a cell-autonomous manner to control the differentiation of multipotential lymphoid-myeloid progenitors. Immunity. 1997;6:437–47.
Stephens DC, Kim HM, Kumar A, Farahat AA, Boykin DW, Poon GM. Pharmacologic efficacy of PU.1 inhibition by heterocyclic dications: a mechanistic analysis. Nucleic Acids Res. 2016;44:4005–13.
Antony-Debre I, Paul A, Leite J, Mitchell K, Kim HM, Carvajal LA, Todorova TI, Huang K, Kumar A, Farahat AA, et al. Pharmacological inhibition of the transcription factor PU.1 in leukemia. J Clin Invest. 2017;127:4297–313.
Wohlfahrt T, Rauber S, Uebe S, Luber M, Soare A, Ekici A, Weber S, Matei AE, Chen CW, Maier C, et al. PU.1 controls fibroblast polarization and tissue fibrosis. Nature. 2019;566:344–9.
Laslo P, Spooner CJ, Warmflash A, Lancki DW, Lee HJ, Sciammas R, Gantner BN, Dinner AR, Singh H. Multilineage transcriptional priming and determination of alternate hematopoietic cell fates. Cell. 2006;126:755–66.
Burda P, Laslo P, Stopka T. The role of PU.1 and GATA-1 transcription factors during normal and leukemogenic hematopoiesis. Leukemia. 2010;24:1249–57.
Burda P, Curik N, Kokavec J, Basova P, Mikulenkova D, Skoultchi AI, Zavadil J, Stopka T. PU.1 activation relieves GATA-1-mediated repression of cebpa and cbfb during leukemia differentiation. Mol Cancer Res. 2009;7:1693–703.
Yashiro T, Kubo M, Ogawa H, Okumura K, Nishiyama C. PU.1 suppresses Th2 cytokine expression via silencing of GATA3 transcription in dendritic cells. PLoS ONE. 2015;10:e0137699.
Mattes J, Collison A, Plank M, Phipps S, Foster PS. Antagonism of microRNA-126 suppresses the effector function of TH2 cells and the development of allergic airways disease. Proc Natl Acad Sci U S A. 2009;106:18704–9.
Chang HC, Zhang S, Thieu VT, Slee RB, Bruns HA, Laribee RN, Klemsz MJ, Kaplan MH. PU.1 expression delineates heterogeneity in primary Th2 cells. Immunity. 2005;22:693–703.
Malmhall C, Alawieh S, Lu Y, Sjostrand M, Bossios A, Eldh M, Radinger M. MicroRNA-155 is essential for T(H)2-mediated allergen-induced eosinophilic inflammation in the lung. J Allergy Clin Immunol. 2014;133:1429–38. 1438 e1421-1427.
Donovan C, Royce SG, Esposito J, Tran J, Ibrahim ZA, Tang ML, Bailey S, Bourke JE. Differential effects of allergen challenge on large and small airway reactivity in mice. PLoS ONE. 2013;8:e74101.
Crimi E, Spanevello A, Neri M, Ind PW, Rossi GA, Brusasco V. Dissociation between airway inflammation and airway hyperresponsiveness in allergic asthma. Am J Respir Crit Care Med. 1998;157:4–9.
Wiggs BR, Bosken C, Pare PD, James A, Hogg JC. A model of airway narrowing in asthma and in chronic obstructive pulmonary disease. Am Rev Respir Dis. 1992;145:1251–8.
Skloot G, Permutt S, Togias A. Airway hyperresponsiveness in asthma: a problem of limited smooth muscle relaxation with inspiration. J Clin Invest. 1995;96:2393–403.
Hemshekhar M, Mostafa DHD, Spicer V, Piyadasa H, Maestre-Batlle D, Bolling AK, Halayko AJ, Carlsten C, Mookherjee N. Sex dimorphism of Allergen-Induced secreted proteins in murine and human lungs. Front Immunol. 2022;13:923986.
Acknowledgements
We thank Tegan Hunter for technical assistance.
Funding
XT is supported by an Australian Government Research Training Program (RTP) Scholarship. RYK was supported by a Lung Foundation Australia Boehringer Ingelheim Fellowship. PMH is supported by a NHMRC Investigator Grant (1175134) and by the University of Technology Sydney, and CD was supported by National Health and Medical Research Council (NHMRC) Early Career Fellowship (1120152) and Grant (1138402).
Author information
Authors and Affiliations
Contributions
XT, HMG, RYK, JCH, PMH and CD contributed to the conception and design of the work. XT, HMG, RYK, ACB and IG acquired and analyzed the data and interpreted the results. EDJ, AB and AF conducted the bioinformatics analyses. XT, JCH, PMH and CD drafted and revised the work for intellectual content. All authors read and approved the final manuscript.
Corresponding authors
Ethics declarations
Ethics approval and consent to participate
All animal studies were performed under protocol A-2017-731 approved by the Animal Care and Ethics Committee at the University of Newcastle.
Consent for publication
Not applicable.
Competing interests
A. Bosco is founder and systems biology lead at INSiGENe Pty Ltd and founder and director at Respiradigm Pty Ltd and received funding from Telethon Kids Institute, Simon Lee Foundation, National Health and Medical Research Council Australia and University of Arizona - all outside the scope of the current manuscript. All other authors declare that they have no competing interests.
Additional information
Publisher’s Note
Springer Nature remains neutral with regard to jurisdictional claims in published maps and institutional affiliations.
Supplementary Information
Additional file 1.
Online supplementary methods. Table S1: Airway and parenchyma network modules. Figure S1: SPI1 overlayed onto the single-cell data from the integrated Human Lung Cell Atlas. Figure S2: SPI1, IL1RN, PTAFR, ITGAX and CLEC7A overlayed onto the single-cell data from the integrated Human Protein Atlas.
Rights and permissions
Open Access This article is licensed under a Creative Commons Attribution 4.0 International License, which permits use, sharing, adaptation, distribution and reproduction in any medium or format, as long as you give appropriate credit to the original author(s) and the source, provide a link to the Creative Commons licence, and indicate if changes were made. The images or other third party material in this article are included in the article's Creative Commons licence, unless indicated otherwise in a credit line to the material. If material is not included in the article's Creative Commons licence and your intended use is not permitted by statutory regulation or exceeds the permitted use, you will need to obtain permission directly from the copyright holder. To view a copy of this licence, visit http://creativecommons.org/licenses/by/4.0/. The Creative Commons Public Domain Dedication waiver (http://creativecommons.org/publicdomain/zero/1.0/) applies to the data made available in this article, unless otherwise stated in a credit line to the data.
About this article

Cite this article
Tu, X., Gomez, H.M., Kim, R.Y. et al. Airway and parenchyma transcriptomics in a house dust mite model of experimental asthma. Respir Res 24, 32 (2023). https://doi.org/10.1186/s12931-022-02298-x
Received:
Accepted:
Published:
DOI: https://doi.org/10.1186/s12931-022-02298-x